01
Data Analysis & BI
- SQL
- Power BI
- Looker Studio
- Tableau
- Excel
- MSBI
- DAX
- KPI
- Data Viz
From raw data to the decision.
I build reliable, automated reportings, dashboards and decision pipelines — from data collection to the business decision.

Trusted by


Data modelling, data quality, reporting automation and data visualization at the service of business teams.
A computer engineer specialised in Business Intelligence and currently in a Big Data & AI Master's on a work-study contract at Veolia, I will be available for a permanent role from September 2026.
I love turning multi-source data into simple, automated and decision-oriented solutions. My playground: data modelling, data quality, reporting automation and data visualization.
Throughout my work-study and internships, I have designed end-to-end ETL pipelines, interactive dashboards and decision-support architectures, in France and in Tunisia.
Multi-source data pipelines on Google Cloud / BigQuery feeding 5 business teams, migration of around fifteen Excel reportings to Looker Studio (reporting time halved), automation via Apps Script (~6 hrs/week saved) and data quality checks.
Business requirements gathering, coordination in an Agile environment, reporting & tracking tools (Power BI, Excel) and automation (VBA) to steer ~10 labelling campaigns (manual processing time cut by ~30%).
Built ETL pipelines (APIs, databases, files) consolidating 5+ sources, Data Warehouse modelling, identification of 3 at-risk customer segments and a monitoring dashboard.
Text-analysis models (NLP, regular expressions) to extract information from a corpus of ~5,000 documents, visualisation and reporting to business teams.
Defined ~15 HR KPIs, designed an ETL pipeline and OLAP cubes, dashboards and reporting with the Microsoft BI suite.
Business Intelligence / ERP major — Highest Honours (with the jury's congratulations), top of the class. Exchange semester in Data Intelligence at ESEO (Paris-Vélizy).
End-to-end pipelines: ingestion, distributed processing, BI and machine learning.
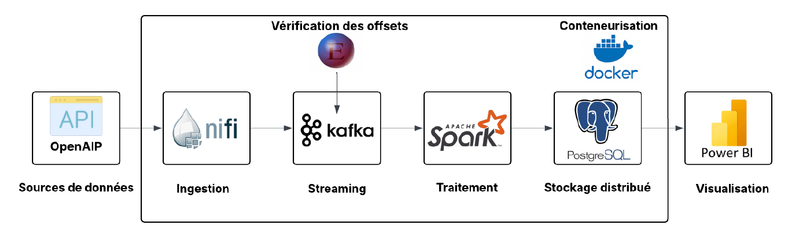
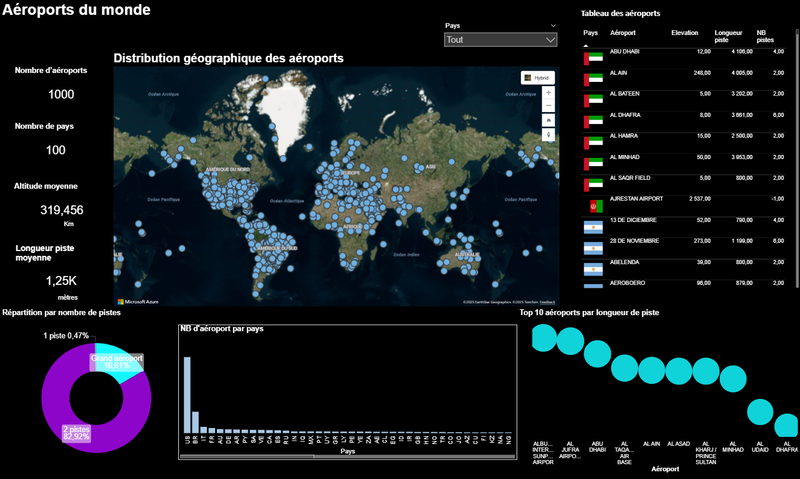
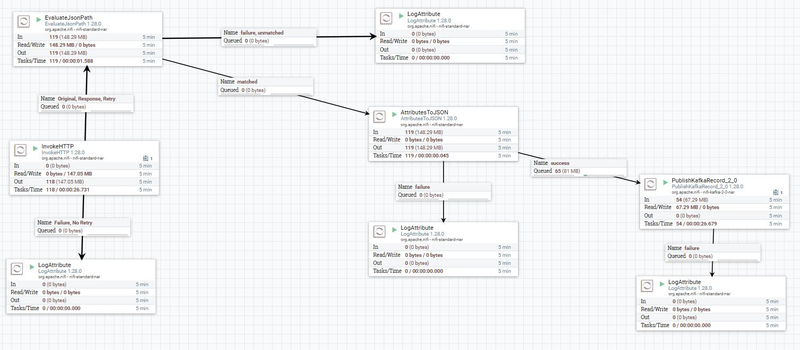
Big Data processing chain for real-time air-traffic analysis. Data from the OpenAIP API is ingested and processed continuously, then surfaced on a map-based dashboard.
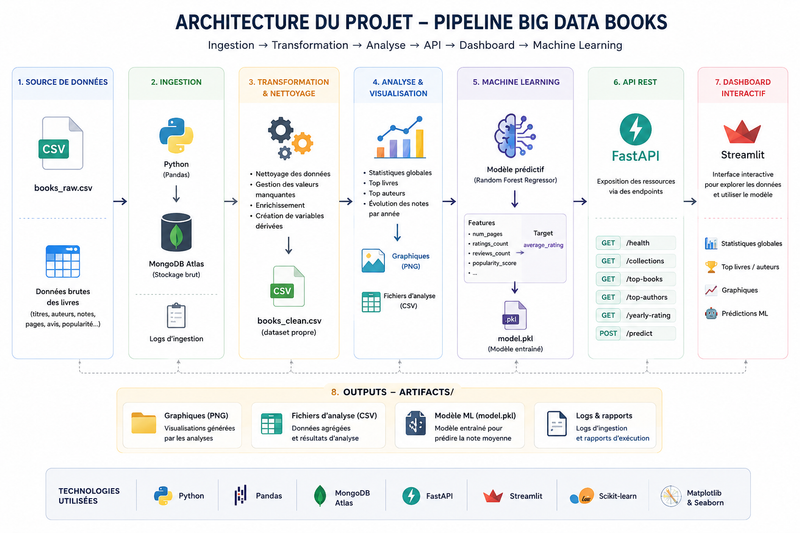
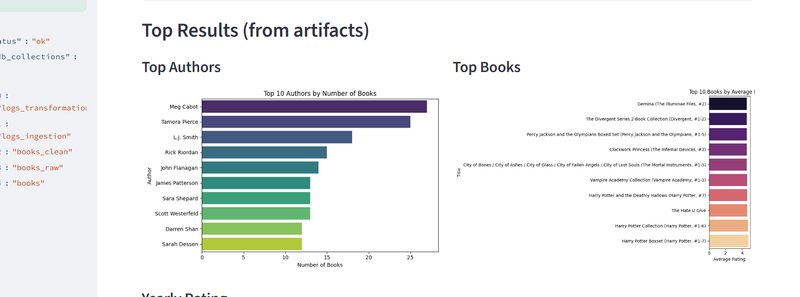
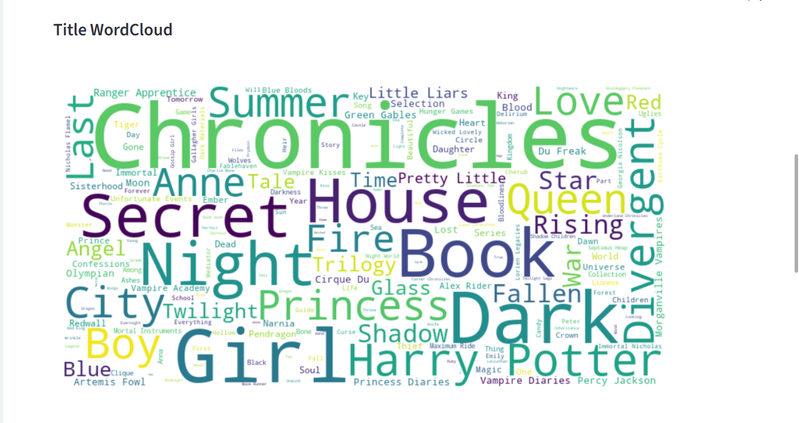
End-to-end data pipeline on a book catalogue: ingestion, cleaning, statistical analysis and a rating-prediction model. Results are exposed through a REST API and an interactive dashboard.
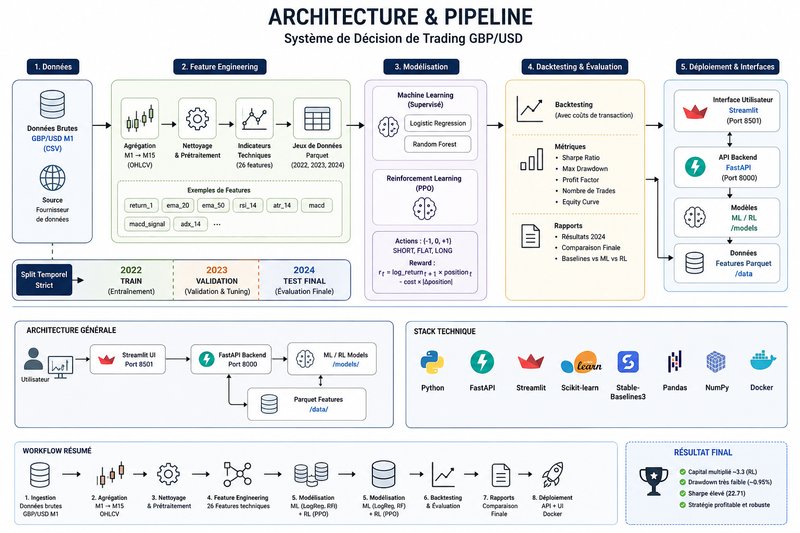
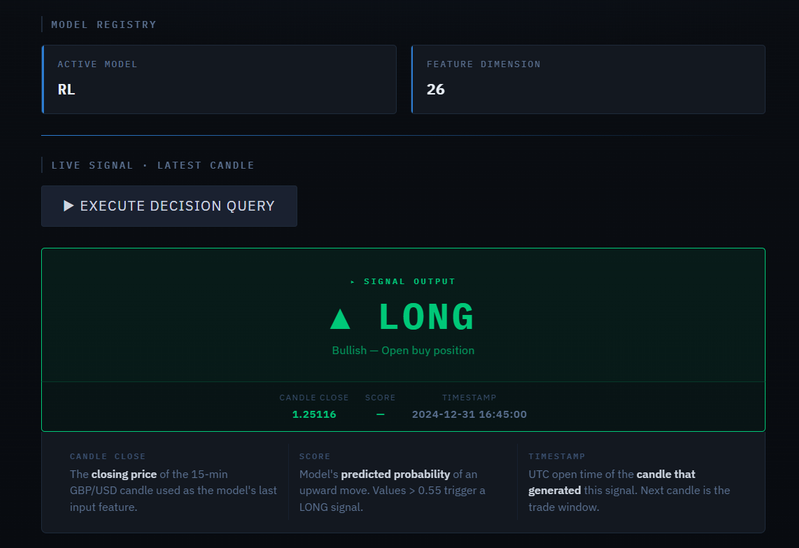
Trading decision system on the GBP/USD pair, combining supervised models and reinforcement learning (PPO). The models are served through an API and driven from an interface, the whole stack containerised.
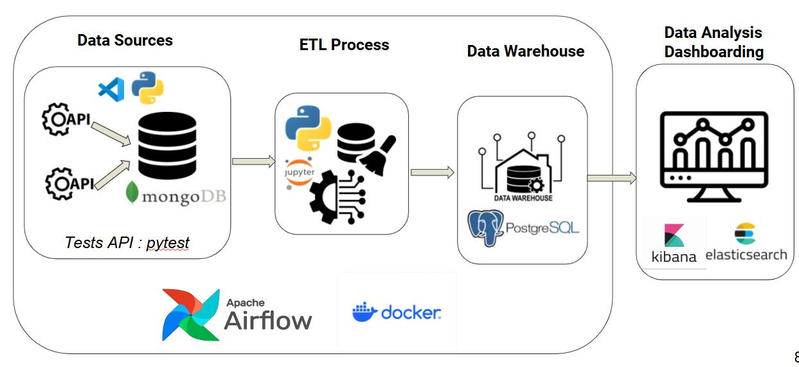
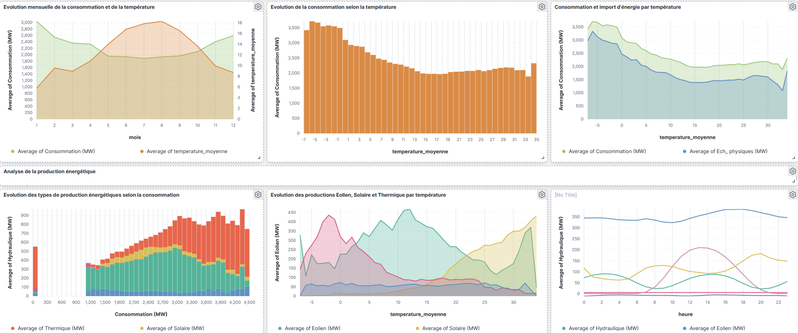
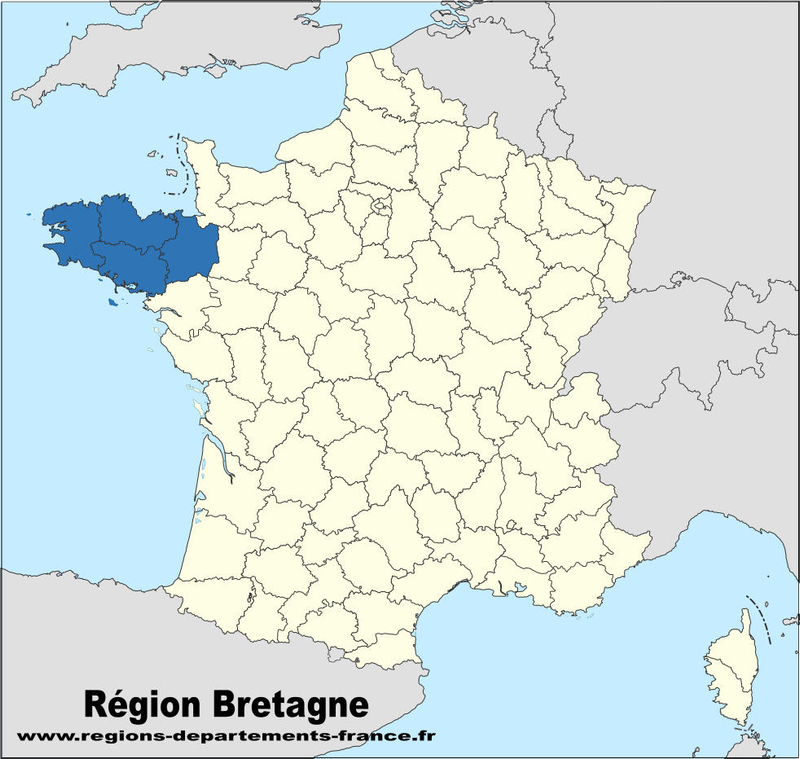
Analysis of how weather conditions influence energy consumption in Brittany, from data collected in real time. Trends and correlations explored with MongoDB and ElasticSearch.
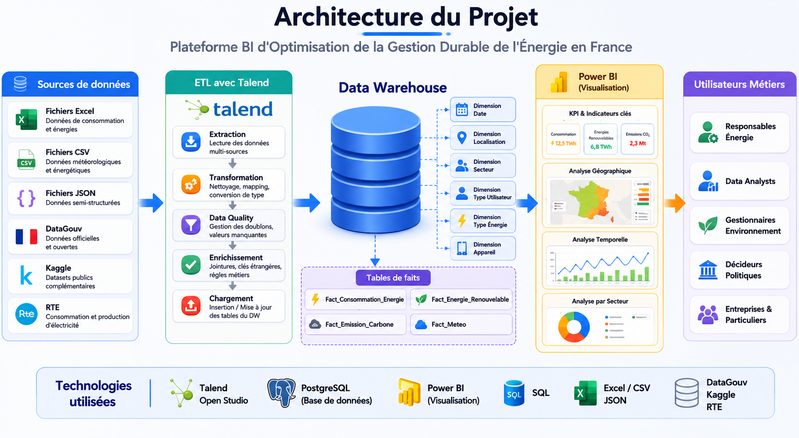
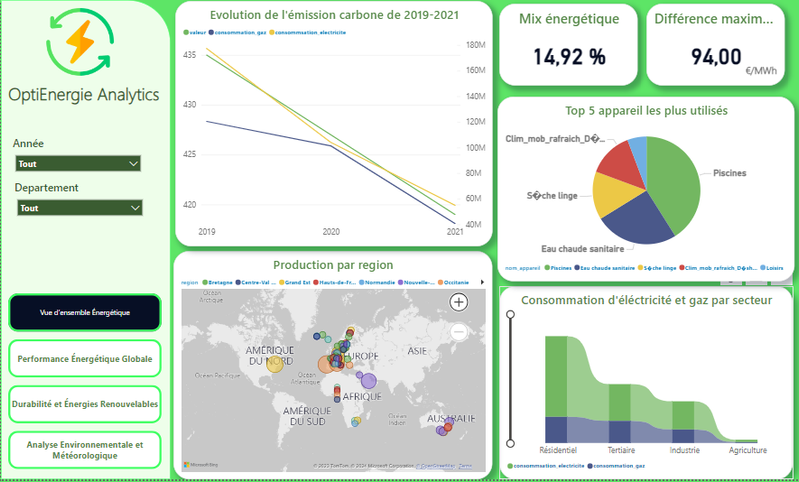
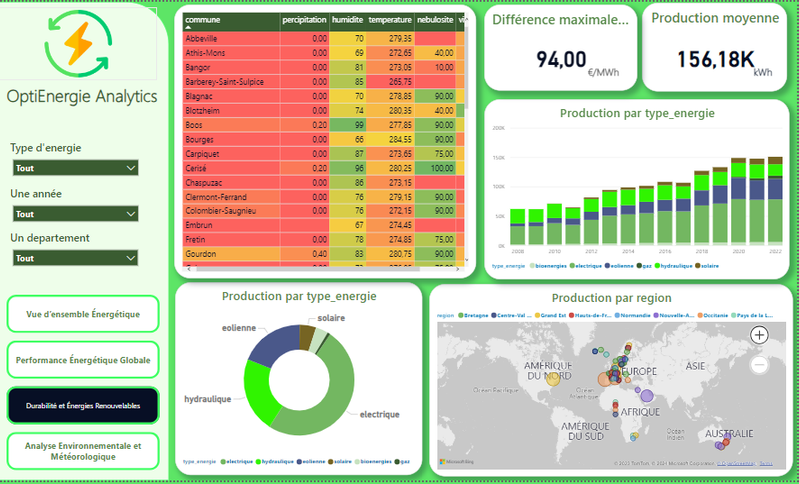
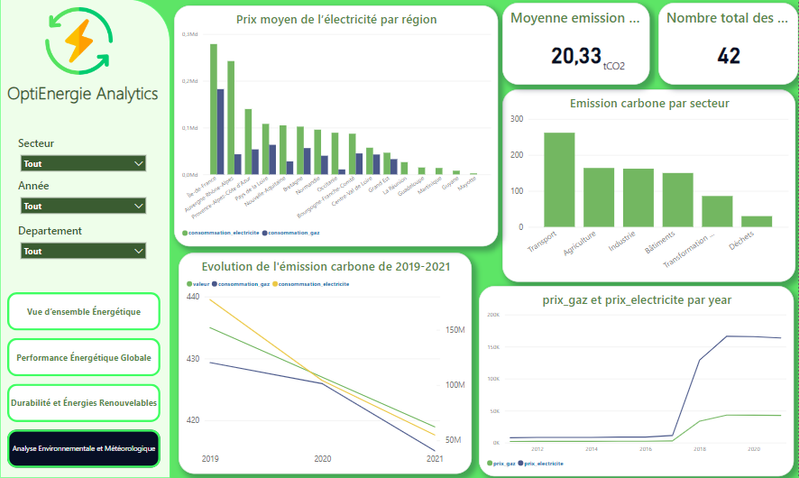
National decision-support platform covering consumption, renewable energy, carbon emissions and weather. Data consolidated from RTE, DataGouv and Kaggle, modelled in a star schema and surfaced in Power BI.
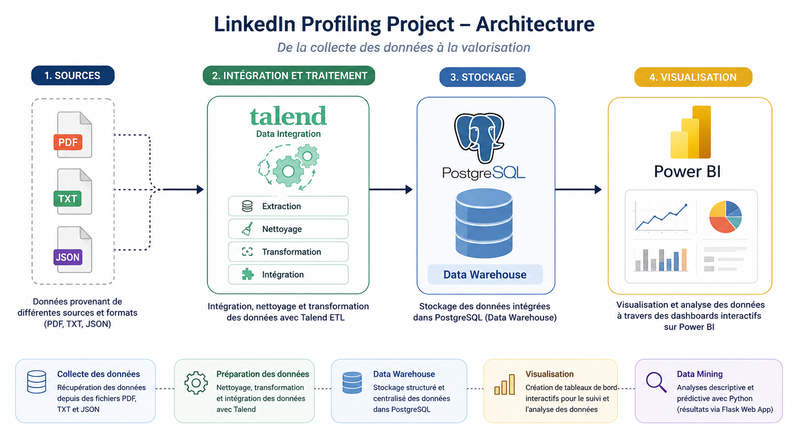
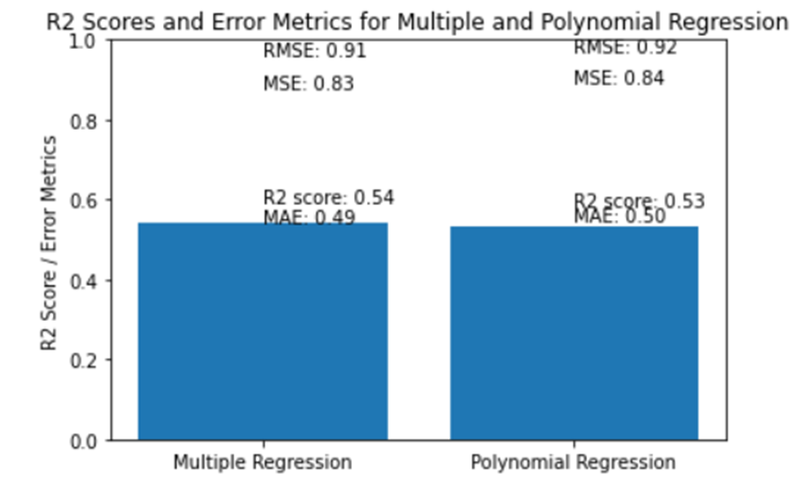
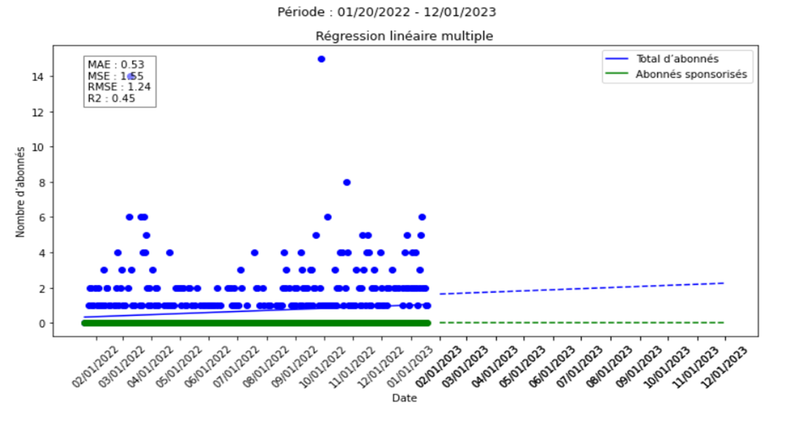
Final-year project: analysis and forecasting of DataRaise's LinkedIn performance. Full data architecture (ETL, warehouse, BI) and follower-forecasting models (SARIMAX, regressions; R² = 0.54).
I turn complex data into clear, interactive dashboards that make performance easier to understand, monitor and act on.
I design complete BI solutions: data collection, modelling and analysis using tools such as Power BI, Tableau, Looker Studio and BigQuery.
I build reliable, automated ETL pipelines to centralise data, improve its quality and reduce repetitive manual work.
I use Python and machine learning to run predictive analyses, detect trends and turn data into business value.
Hiring a Data Analyst / BI on a permanent contract from September 2026? Let's talk.